The one canonical plan, the rules the live checklist runs on, and everything the data taught us. Every other page quotes the box below instead of restating it.
Start here
The two kinds of setup
Every signal is sorted into one of two buckets — clean or risky. Here is what each one means in plain English.
| Type | What it is | How it has done |
|---|
| clean |
The textbook version. The first candle is green, so price was already pushing up. The pause candle pokes a little higher, then settles back and closes in the upper part of that green candle. No surprise jumps overnight. |
The stronger signal. It finished green in the next candle — of the time — and — of the time when it set up in the afternoon to hold overnight. |
| risky |
Still a real signal, but something is off. Any one of these makes it risky: the first candle was actually red and only counts on a gap-up; the pause closed low (bottom half of the green candle); or price gapped right into the setup. |
Close to a coin flip — green about — of the time. Trade it smaller, or skip it. |
Bottom line: clean = trust it more. Risky = handle with care, or pass.
Dug out of the data
Not all “risky” is equal
A setup gets the risky tag for one of three reasons — and they don’t all perform the same. We split the — risky setups below.
First: which flaw flagged it?
A setup can trip more than one flag, so these overlap. Each flag on its own:
| Why it was flagged risky | Win rate | Avg peak |
|---|
But the real splitter is the push
The same “strong push” signal cuts the risky bucket roughly in half:
| Risky setup, split by… | Win rate | Verdict |
|---|
So which risky trades are worth taking?
- Take: a risky setup with a strong push, held intraday.
- Skip: a weak push (about half of all risky setups), or an overnight risky.
- Weakest flag: the red-push variant. If that is the only thing making it a setup, lean toward passing.
Small buckets — a dozen-ish trades each. Treat this as a tilt, not a guarantee.
3 Real examples
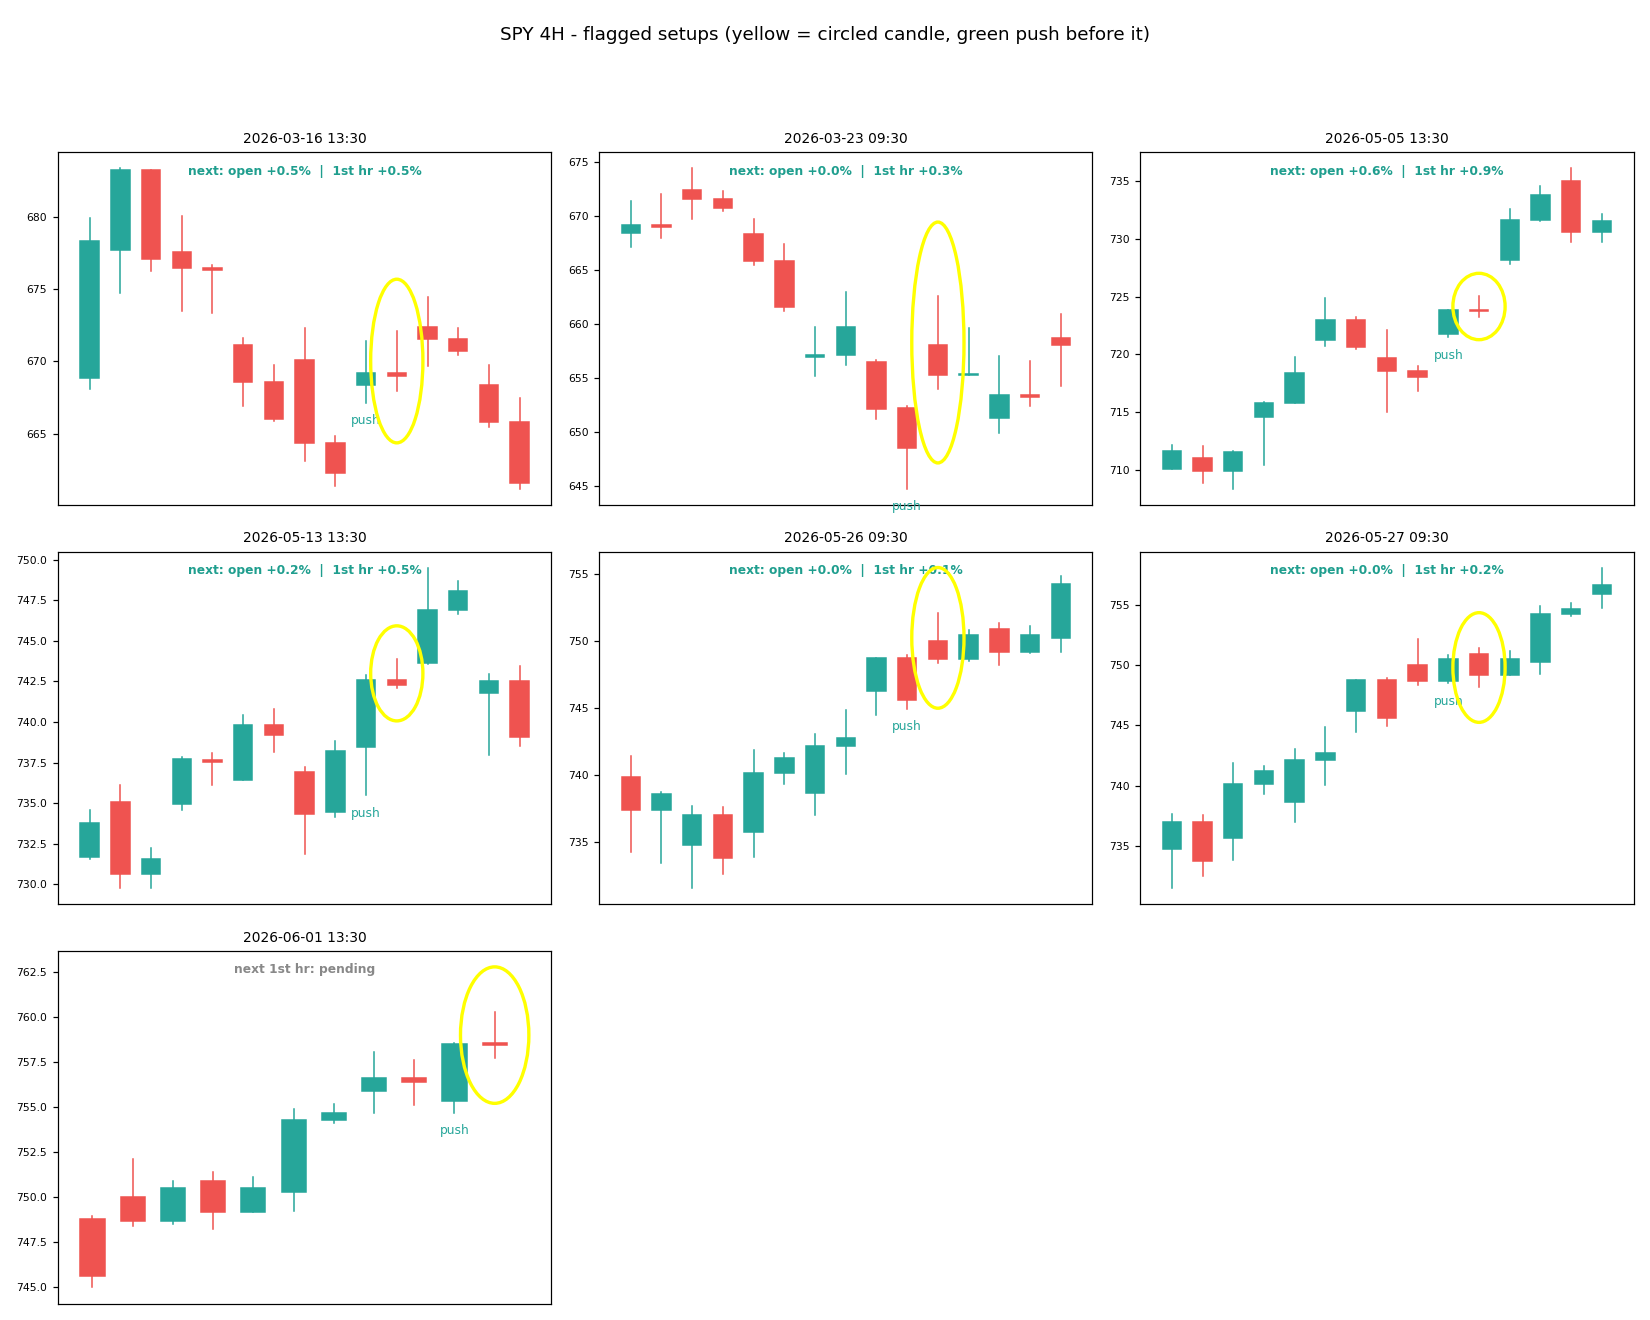
Each yellow ring is a real pause candle the detector flagged on SPY. The green candle right before it is the push.
Recent SPY 4-hour setups. Yellow ring = the pause candle; green “push” = the candle before it.
Dug out of the data
What separates the best plays from the worst
Beyond clean/risky, we compared the — winners against the — losers. Win-rate splits cut all setups at the middle value of each signal.
| Signal | The good ones… | Win rate split |
|---|
The “best play” profile. Stack the strong signals and the win rate climbs:
Read these as leads, not laws. Some buckets are small, so the day-of-week edge especially could soften. The strong-push filter is the single biggest lever.
Options study
15-delta call: sell at open or after the first hour?
Instead of the peak, what if you bought one 15-delta call (~0.15 delta) on each setup and sold at a fixed time? Modeled at 2 DTE, 14% IV. Each cell shows the green rate (% that finished above where you bought) and, smaller, the median return.
About “first hour”: Sell at open and after 1st hr are measured from your entry at the setup’s close (so an overnight setup includes the gap plus ~18h of decay). First hour only buys at the next open and sells one hour later — the open→+1hr move alone.
| Setup type | # | Sell at open | After 1st hr | First hour only |
|---|
The open is a theta trap. Selling a 15-delta call right at the next open finishes green only about — of the time — the overnight gap almost never covers ~18 hours of decay on a 2-day option. Buy at the open and sell a little later and clean setups went green far more often. Bottom line: don’t hold a cheap call overnight to sell at the bell — enter at the open and give the morning move a little room.
So how long do you hold?
Once you buy at the open, when do you sell? We tested 1, 2, and 3 hours and the lunchtime close, across all 24 clean-overnight setups, with the option priced the realistic way (bought at the higher “open” volatility, which then fades).
| Hold (after buying at the open) | Win rate | Median gain |
|---|
| 1 hour — the sweet spot | 54% | +15% |
| 2 hours | 54% | +5% |
| 3 hours | 42% | −8% |
| To the lunchtime close (~3.5 hrs) | 50% | +5% |
Why holding longer stops helping. Two forces get stronger through the morning: time decay (theta) melts value every hour, faster near expiry; and the fear premium (IV) crushes from its open high as the market settles. Early on SPY moves fast enough to pay more than these take; by late morning the move slows but the decay does not. That is why the sweet spot is early — which is exactly what the playbook box up top says.
Show all setups, date by date
Option % return per setup. Intraday setups have ~0% “at open” by construction.
| Setup (circled) | Type | Hold | At open | After 1st hr | First hr only |
|---|
15-delta call, 2 DTE, flat 14% IV, sold for time value. A real 15-delta strike carries higher IV than this flat assumption, and fills on cheap OTM contracts are wide — treat these as directional, not exact.